

Pakistan Inflation Rate (Current, Historical & Forecast)
Latest Inflation Update (YoY & MoM)
Pakistan’s year-on-year inflation reached 5.8% in January 2026, up from 5.6% in December, according to the Pakistan Bureau of Statistics (PBS).
Consumer prices rose 0.4% month-on-month, recovering from a 0.4% decline in December.
Food and non-alcoholic beverage prices climbed 3.9%, faster than December’s 3.2%.
Housing, water, electricity, and gas increased 7.3%, compared to 6.9% last month.
Miscellaneous goods and services jumped 20.97%, while transport costs eased to 2.61% from 4.94%.
The inflation rate remains within the State Bank of Pakistan’s 5–7% target range and aligns with the Ministry of Finance forecast of 5–6%.
Key drivers include rising food prices, energy adjustments, and utility costs. Some sectors, like transport, showed moderation.
Summary Table—Latest Inflation Data
| Indicator | Value (Jan 2026) | Notes |
| YoY Inflation | 5.8% | PBS data |
| MoM CPI | 0.4% | Monthly change in prices |
| Core Inflation | 5.5% | Excludes food and energy |
| Urban Inflation | 6.0% | Major cities |
| Rural Inflation | 5.2% | Countryside areas |
| Food Inflation | 3.9% | Key staples and beverages |
| Non-Food Inflation | 6.5% | Housing, utilities, transport |
| Energy Basket | 8.1% | Electricity, gas, fuel |
| Punjab | 5.9% | Provincial variation |
| Sindh | 6.2% | Provincial variation |
| Khyber Pakhtunkhwa | 5.4% | Provincial variation |
| Balochistan | 5.1% | Provincial variation |
Pakistan Inflation Rate—Long-Term Overview
Pakistan’s inflation averaged 8.36% from 1957 to 2026.
The lowest recorded inflation was -10.32% in February 1959. The highest was 37.97% in May 2023.
Significant spikes occurred during currency depreciation, global commodity shocks, and periods of high fiscal deficit.
Decades of policy changes, subsidies, and energy adjustments have shaped the inflation trajectory.
Structural factors, such as reliance on imported energy and fluctuating food supply, continue to influence current trends.
Also Read PSER Registration Online (پی ایس ای آر صارف اندراج) in 2026
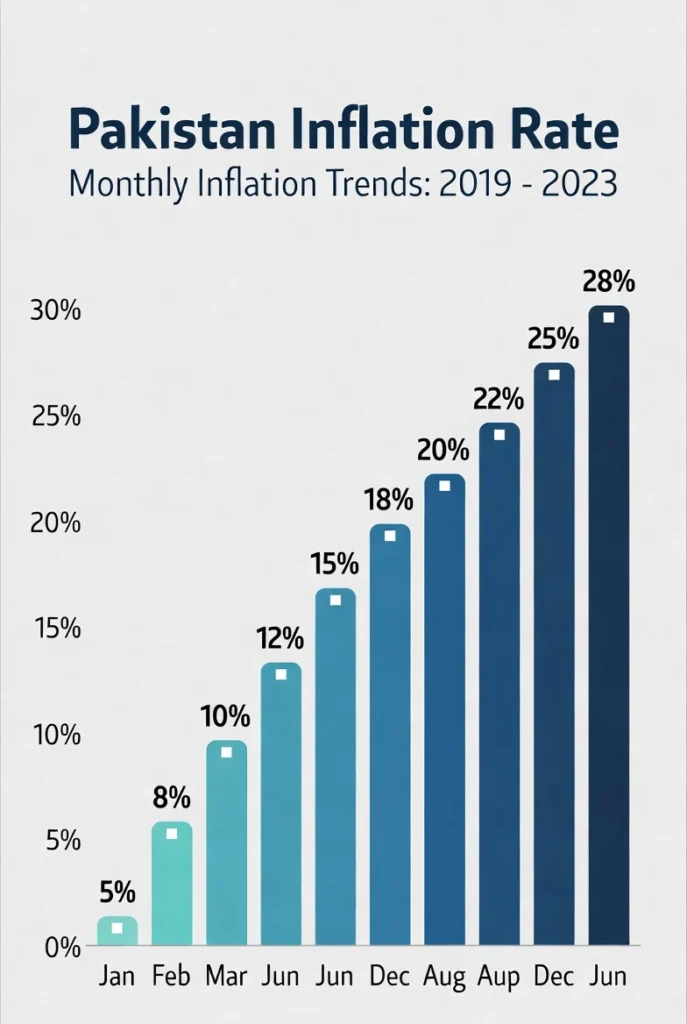
Inflation Chart (Interactive)
- YoY Trend: Shows steady movement around the SBP target, with notable peaks in 2022–2023.
- MoM Trend: Month-to-month fluctuations indicate seasonal food price changes and energy adjustments.
- SBP Policy Rate Comparison: Inflation often reacts to rate hikes or cuts.
- PKR Exchange Rate Comparison: Currency depreciation drives import costs and inflation.
Inflation Breakdown by Category
Food & Non-Alcoholic Beverages
Prices rose sharply due to staple food items, cooking oil, and beverages. Imported items, like sugar and pulses, contributed to higher costs.
Housing, Water, Electricity & Gas
Utility adjustments pushed prices up, especially in urban areas. Rental increases also added pressure.
Transport
Fuel prices fell slightly this month, easing transport inflation. Public transport fares remained stable.
Clothing & Footwear
Prices increased moderately due to seasonal demand and imported textile costs.
Health & Education
Medical fees and school-related costs rose slowly. Pharmaceuticals remained mostly stable.
Miscellaneous Goods & Services
Luxury goods, personal care items, and services saw rapid growth, contributing significantly to overall inflation.
Urban vs Rural Inflation
Urban areas faced higher price increases (6.0% YoY) than rural areas (5.2% YoY).
Cities see sharper utility, housing, and food price rises. Rural regions mostly face agricultural product fluctuations.
Household budgets in urban centers are more affected by energy and transport costs. Rural households feel food price spikes more.
Core Inflation (Non-food, Non-energy)
Core inflation remains 5.5%, slightly below headline inflation.
It reflects the underlying price trend without volatile food and energy items.
Tracking core inflation helps policymakers anticipate future inflation pressures.
The trend has been steady over the last few months, indicating moderate underlying price pressures.
Causes of Inflation in Pakistan (Current Cycle)
Inflation in Pakistan rises due to multiple factors. These combine to affect the cost of living for households and businesses.
PKR Depreciation
The Pakistani rupee weakened against the US dollar in recent months. This increased import costs for fuel, machinery, and raw materials. Imported goods became more expensive, adding pressure to overall prices.
Energy Price Adjustments
Electricity, gas, and petroleum prices rose. Subsidy reductions and international energy costs translated into higher household and business expenses.
Supply Shocks
Crop failures, floods, or logistical bottlenecks caused sudden shortages. Short supply of key commodities, especially food, pushed prices up.
Global Commodity Trends
Rising international oil, wheat, and sugar prices affected domestic markets. Pakistan, being an importer of key commodities, faces direct inflationary pressure.
Administrative Price Updates
Government-regulated items such as utilities, gas, and public transport periodically adjust. These administrative changes influence headline inflation.
Fiscal and Monetary Factors
High fiscal deficit, borrowing, and money supply growth increase demand. Combined with constrained supply, they push prices upward.
Government & SBP Response
The government and State Bank of Pakistan (SBP) act to control inflation. Their measures target both supply and demand factors.
Monetary Policy Committee (MPC) Decisions
SBP uses interest rates to manage inflation. Raising the policy rate discourages borrowing and spending, lowering demand.
Reducing rates stimulates the economy but may increase inflation.
SBP also manages liquidity to stabilize markets and ensure financial balance.
Fiscal Measures
The government adjusts subsidies to moderate consumer prices.
Tax changes influence consumption patterns.
Import restrictions limit demand for foreign goods but may increase domestic costs.
Register online now for the 9999 Nigehban Ramzan Package in Punjab for the year 2026!
Inflation Forecast for Pakistan
Forecasts combine models, expert analysis, and economic indicators. They guide households, businesses, and policymakers.
Short-Term Outlook (Next Quarter)
Inflation is projected near 5.0–5.5%, depending on energy costs, rupee stability, and seasonal food supply.
Analysts expect moderate fluctuations month-to-month, with some easing in transport and energy sectors.
Long-Term Outlook (1–3 Years)
Inflation may trend around 5.3–5.5% in 2027–2028.
Assumptions include a stable PKR exchange rate, a controlled fiscal deficit, and normal agricultural output.
Global commodity volatility or unexpected shocks could alter projections.
Historical Data—Downloadable & Interactive
Annual Inflation Table (1957–2026)
Provides year-on-year inflation data. Highlights record highs and lows. Helps analyze long-term trends.
Monthly CPI Data (Last 10 Years)
Shows short-term fluctuations and seasonal patterns. Useful for policymakers and economists.
Category-Wise Historical Trends
Tracks price changes by sector: food, energy, housing, transport, health, and miscellaneous goods.
Reveals which items contribute most to overall inflation.
Related Indicators
Understanding inflation requires looking at related economic indicators. These show broader economic trends and help explain price movements.
- Policy Rate—Set by SBP, it controls borrowing costs and affects inflation.
- Money Supply (M2)—Growth in money supply can increase demand, putting pressure on prices.
- Exchange Rate (PKR/USD)—A weaker rupee raises import costs, especially fuel and machinery.
- GDP Growth—Faster growth can boost demand, sometimes adding to inflation.
- Unemployment—High unemployment reduces household spending, easing inflationary pressure.
- Fiscal Deficit—Large deficits often lead to more borrowing and higher inflation.
- Consumer Confidence Index – Indicates how households plan spending; high confidence can push prices higher.
Impact of Inflation on Daily Life
Inflation directly affects households and businesses. Understanding its impact helps readers manage budgets and plan expenses.
Food Basket Changes
Staple food items like wheat, rice, and vegetables have risen. Households spend more on basic groceries.
Utility Bill Increases
Electricity, gas, and water bills climbed. Urban households feel the impact more than rural areas.
Transport and Fuel Costs
Fuel price changes affect both personal and public transport. Rising fuel costs increase delivery and logistics charges.
Household Budget Stress
Higher food, utility, and transport costs reduce disposable income. Families adjust spending on non-essential items.
Impact on Small Businesses
Rising input costs squeeze profit margins. Many small businesses pass some costs to customers, creating a ripple effect.
FAQs
What is Pakistan’s current inflation rate?
Pakistan’s year-on-year inflation is 5.8% as of January 2026 (PBS).
Who publishes inflation data?
The Pakistan Bureau of Statistics (PBS) provides official inflation data.
What causes inflation in Pakistan?
Inflation rises due to PKR depreciation, energy prices, supply shocks, fiscal policies, and global commodity trends.
How does SBP control inflation?
SBP adjusts the policy rate and manages liquidity to stabilize prices.
How does inflation affect the rupee?
Higher inflation can weaken the PKR, increasing import costs and reducing purchasing power.
How often is CPI updated?
PBS updates the Consumer Price Index (CPI) monthly.
Conclusion
Pakistan’s inflation rate has stabilised at low levels in early 2026, with the latest CPI reading at 5.8% year-on-year in January (up slightly from 5.6% in December 2025). This remains within the State Bank of Pakistan’s 5–7% target range and reflects successful disinflation from the high peaks of 2023, supported by prudent monetary policy and structural reforms.
Discover the latest Pakistan inflation rate: 5.8% YoY in January 2026 (CPI data from PBS). Track trends, historical highs/lows, forecasts, and economic insights for Pakistan’s consumer prices.